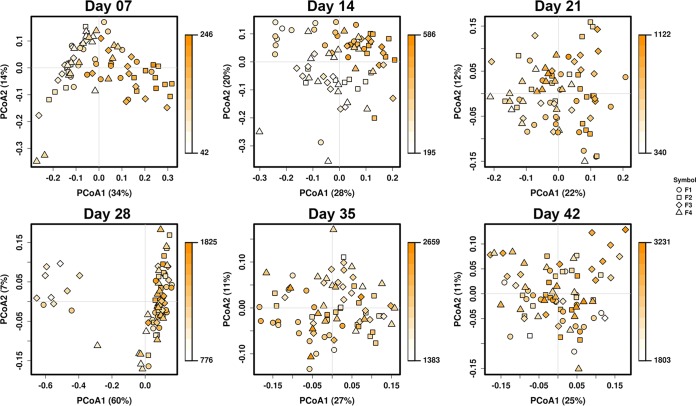
FIG 5.
Correlations between broiler weight and its cecal microbiota. Principal-coordinate analysis of cecum samples from flock cycles 1 and 2 was performed. Samples are colored by total body weight and scaled to minimum and maximum weights for each sampling age. Sample shapes represent the four different flocks (F) sampled during each flock cycle.

