
FIG 3.
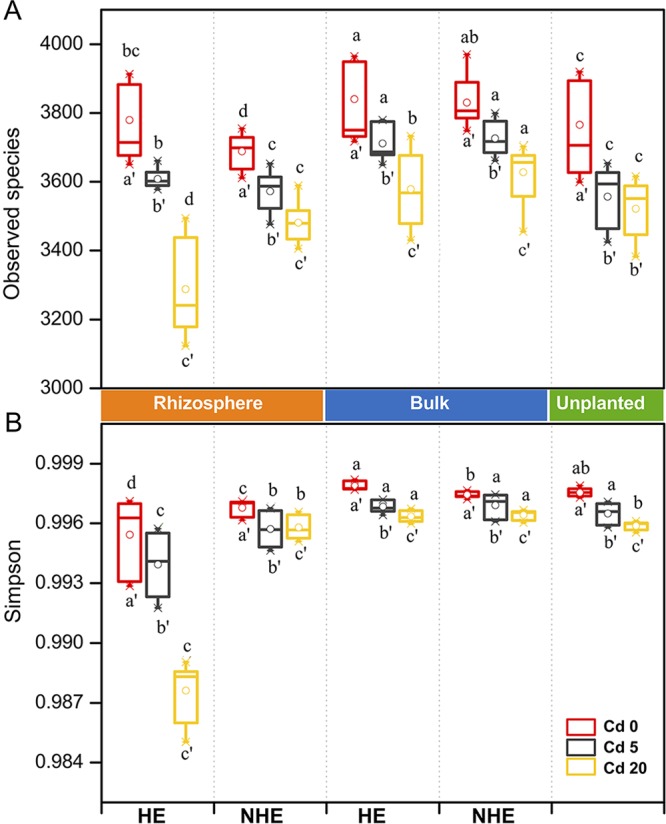
Box plots for alpha-diversity indices, including the number of observed species (A) and the Simpson's index of the bacterial communities (B) in different compartments under different Cd treatments. The lines at the top, bottom, and middle of the box correspond to the 75th, 25th, and 50th percentiles (median), respectively. Whiskers indicate the standard deviations. The white dots indicate the mean values. The various letters above the box indicate significant differences among samples of the same Cd level at P < 0.05. The various letters below the box indicate significant differences among different Cd levels at P < 0.05. Refer to Fig. 1 for treatment notation.