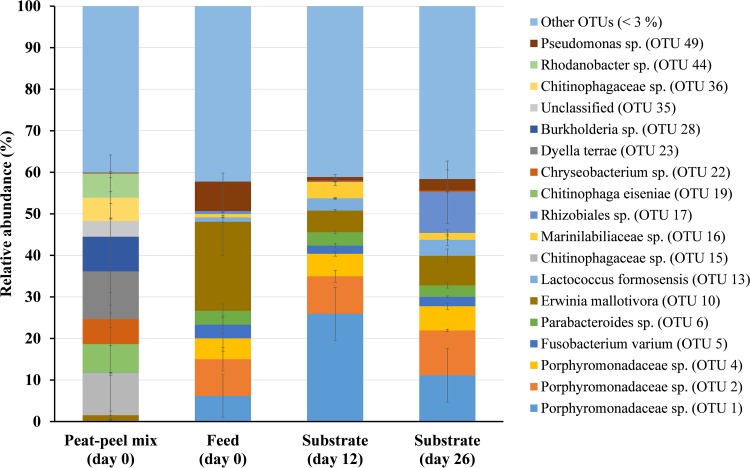
FIG 2.
Relative abundance (%) of OTUs present in the peat-peel mix, feed and substrate. Data are mean values of two extracts per sample from two samples. Error bars represent the standard deviation. Only OTUs represented by an average relative abundance of more than 3% of sequences in any sample are shown. OTUs with a mean relative abundance of less than 3% are grouped in “Other OTUs (<3%)”.

