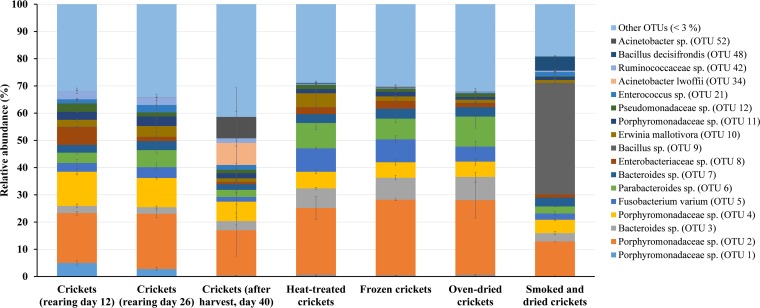
FIG 3.
Relative abundance (%) of OTUs present in the crickets during the rearing phase and after processing. Data are mean values of two extracts per sample from one (crickets at day 40 and smoked/dried crickets) or two cricket samples. Error bars represent the standard deviation. Only OTUs represented by an average relative abundance of more than 3% of sequences in any sample are shown. OTUs with a mean relative abundance of less than 3% are grouped in “Other OTUs (<3%)”.

