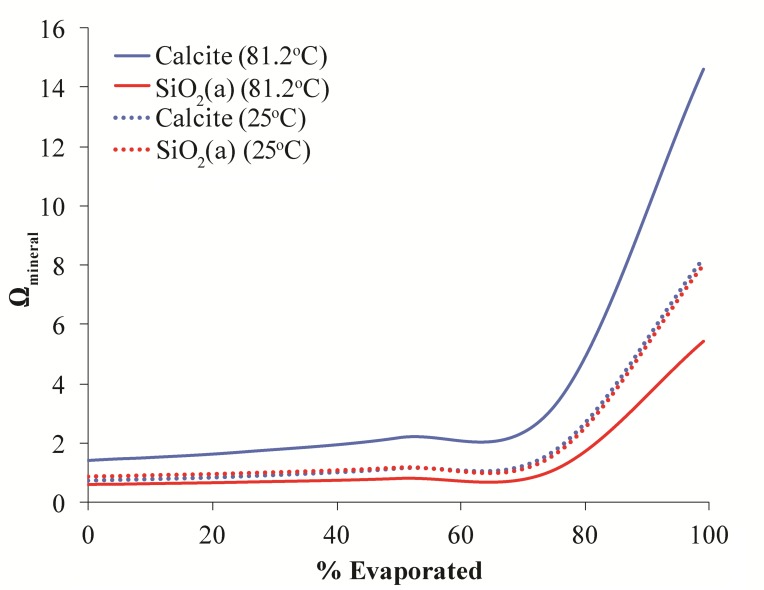
FIGURE 7.
Model results for evolution of the saturation state of calcite (blue lines) and amorphous silica (red lines) during evaporation at 81.2°C and (solid lines) and 25°C (dashed lines). The saturation state of both minerals begins to increase when ∼70% of water has been evaporated. At high temperature calcite precipitation is more thermodynamically favorable than silica precipitation. However, at cooler temperatures both minerals are equally favorable.

