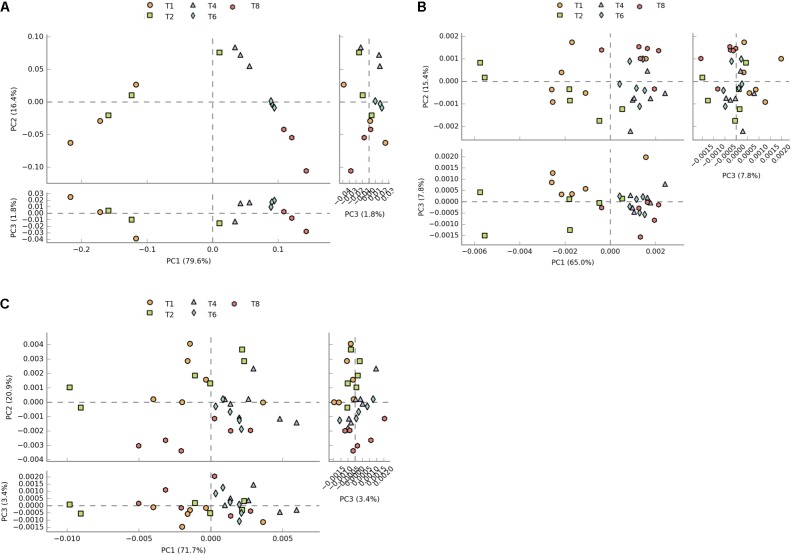
FIGURE 2.
Plots of principal components of distances between sample pathway profiles. (A) PC1 accounts for 79.6% and PC2 16.4% of the variation between samples in the transcriptome dataset. (B) PC1 accounts for 65% and PC2 for 15% of variation in the PICRUSt predicted pathways. (C) For the CowPI predicted pathways, PC1 represents 71.7% of the variation and PC2, 20%.

