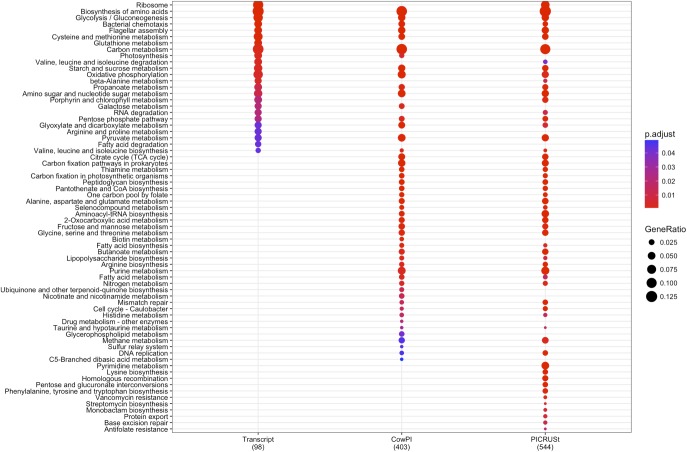
FIGURE 3.
Significantly over-represented KEGG functional hierarchies by differentially abundant KEGG orthologs (KOs) between 2 and 4 h samples for each dataset. Circle size represents KO counts within that pathway in proportion to the total number of differentially abundant KOs, while red coloration represents lower P value and therefore higher significance. Numbers in parentheses are the total number of KOs contributing to the analysis.

