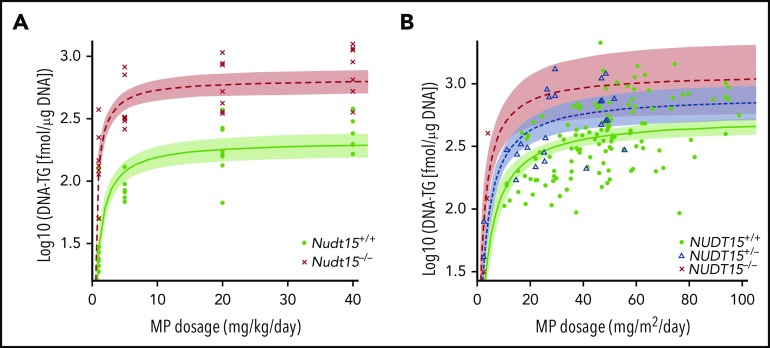
Figure 4.
Effects of MP dose adjustments on active metabolite DNA-TG accumulation in vivo. (A) Mice received daily MP injections at 4 different doe levels, and DNA-TG was measured in bone marrow mononucleated cells on day 5. At each dosage level, 8 mice of each genotype were included. (B) In 95 children with ALL, DNA-TG was monitored longitudinally during MP dosage titration. In both mice and patients, trend lines were established to describe the relationship of MP dosage with DNA-TG, using Michaelis-Menten kinetics model. Shades indicate 95% confidence intervals of the model.

