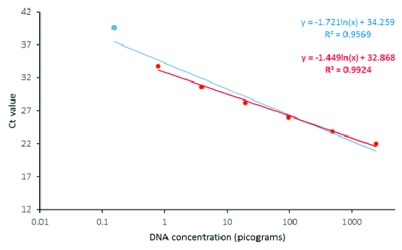
Figure 1. Cyt b TaqMan standard curve for across a fivefold dilution series of gDNA from An. gambiae s.s. The blue line shows a regression line fitted through all points, with associated equation in blue font (upper equation).
The red line shows a line plotted through points excluding the lowest concentration sample, with associated equation in red font (lower equation).

