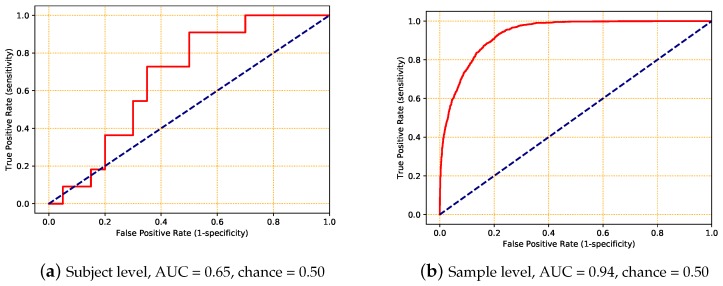
Figure 6.
Examples of the receiver operating characteristic (ROC) curves (solid red lines) and their corresponding area under the curve (AUC) values obtained using a ConvLSTM model. The dashed blue line represents the ROC for chance. The dataset was split at (a) the subject level and (b) the sample level.

