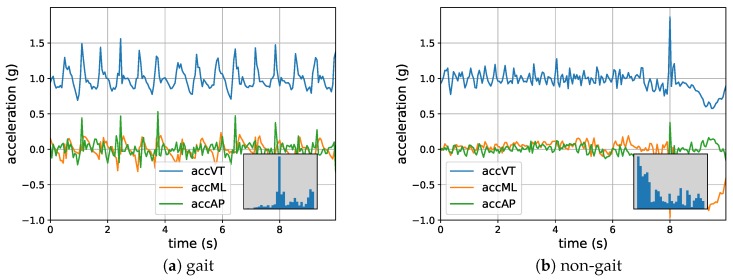
Figure 9.
(a) An example of a 10-s data sample included in the training and testing set and (b) an example of a data sample excluded in Experiment 5 due to the low dominant frequencies in the VT-axis. In the bottom-right corners, histograms of the VT-frequencies up to 3 Hz are depicted. Both examples were included in the first 4 experiments.

