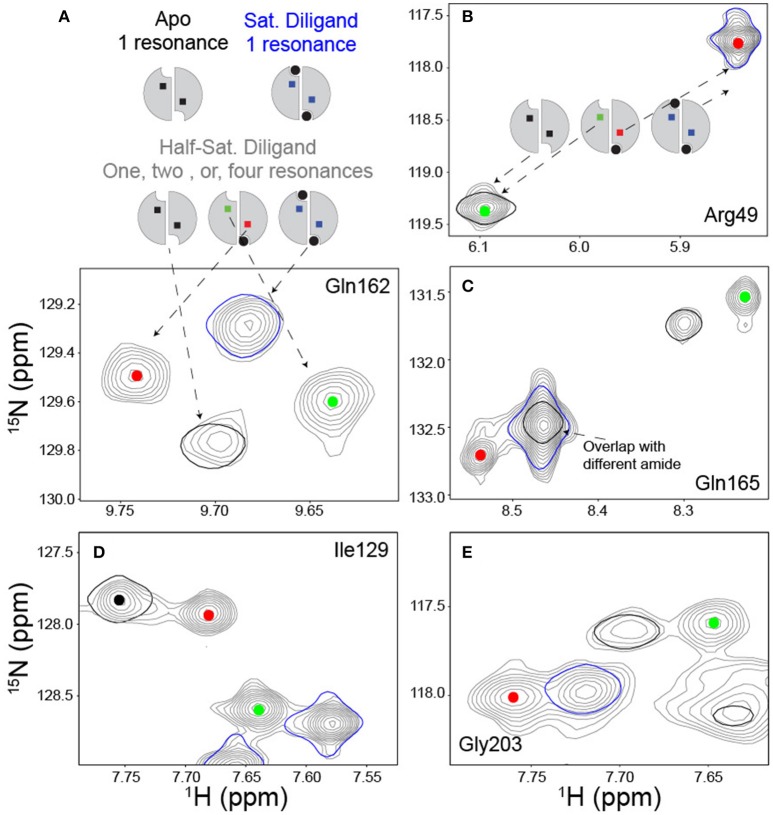
Figure 5.
Ligand state peak multiplets in a FdUMP/mTHF (diligand) titration. (A) Scheme and spectra of amide with a quartet peak pattern at midpoint of diligand titration. In the scheme, the ligand is shown in black circles and the reporter amide is shown in squares. The titration midpoint spectrum is shown in gray, and the apo and saturated diligand spectra (single contour lines) are shown in black and blue respectively. The red and green dots serve to identify resonances arising from the empty and bound subunits respectively of the singly bound state. (B) Example of amide reporter with a doublet peak pattern in which the signal from the empty subunit of the singly bound state overlays with the apo spectrum and the signal from the bound subunit of the singly bound state overlays with the saturated dilagand spectrum. Spectra are colored as described in (A). (C–E) Panels provide additional examples of quartet amides and are colored as described above.

