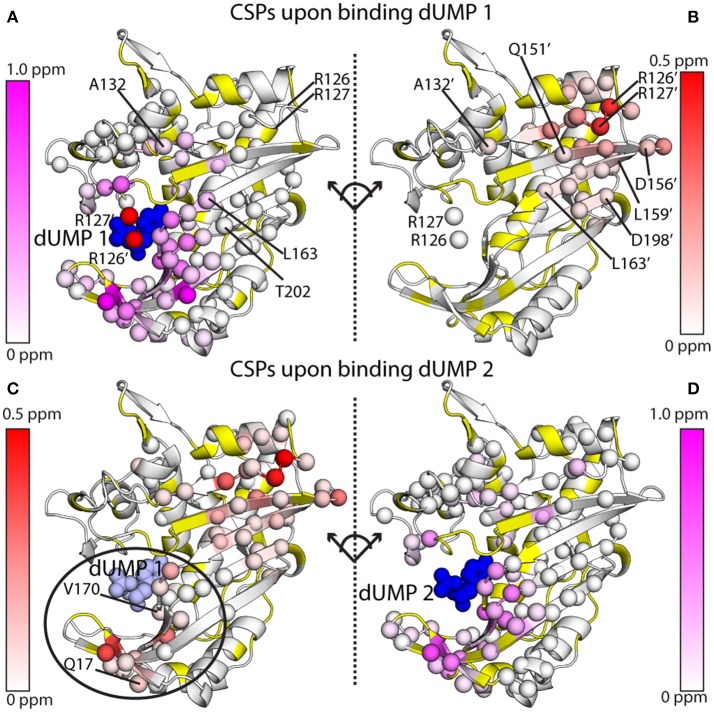
Figure 7.
1H-15N amide chemical shift perturbations (CSPs) for the two dUMP binding events for ecTS, obtained from MLD samples as shown in Figure 6. (A,B) CSPs are shown for binding of the first dUMP (blue spheres). CSPs are shown for the binding subunit (A) and the empty subunit (B), which are split apart and rotated to take on the same orientation for ease of comparison. Residues from the empty subunit are indicated by primes, and in panel A R126' and R127' from the empty subunit are shown as red spheres, showing how these two residues contact dUMP in the opposite binding site. CSP values are colored according to the scaling scheme shown in each panel. (C,D) CSPs are shown for binding of the second dUMP (blue spheres), with the first dUMP shown in light blue spheres. Data are taken from Falk et al. (2016), which also describes how the chemical shifts were corrected and reconstructed for the wild-type peaks to allow calculation of CSPs for the second dUMP.

