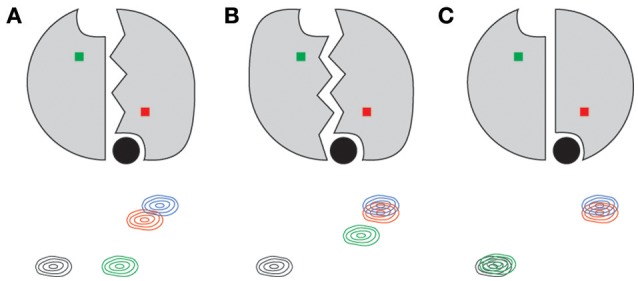
Figure 8.

Simple structure-based expectations of quartet peak positions for a symmetric dimer such as thymidylate synthase. Ligand is shown as a filled black circle for each lig1 state shown. The residue amide giving rise to the 2D peaks are shown as red and green squares, corresponding to the bound and empty subunits, respectively. Conformational change in a protomer is indicated by jagged lines at the interface. Panels indicate conformational change in the binding protomer only (A), both protomers (B), and in neither (C).
