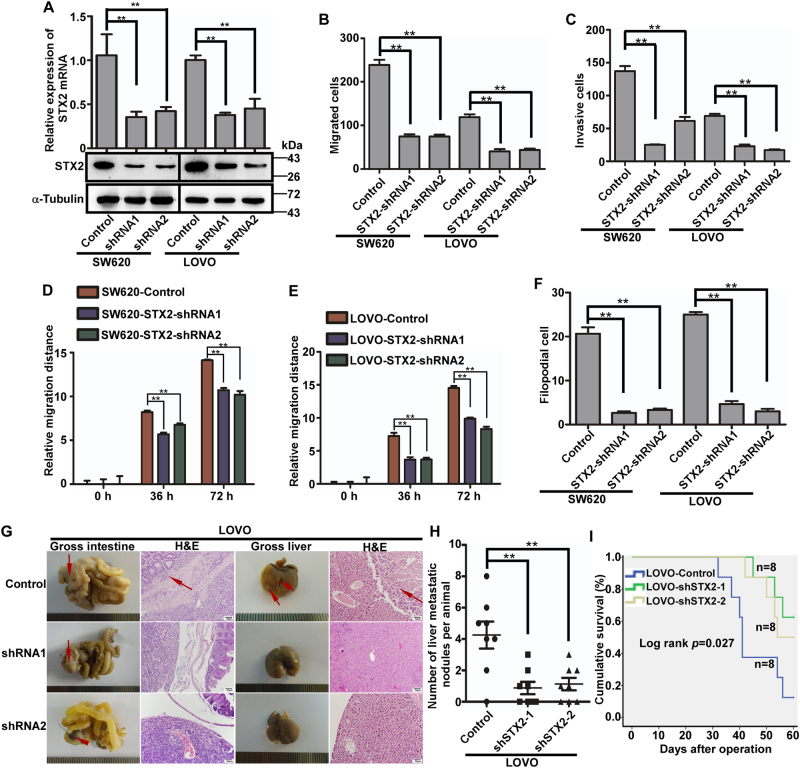
Fig. 3. Downregulation of STX2 repressed the metastatic potential of CRC cells in vitro and in vivo.
a qPCR and western blot analyses of STX2 in specific shRNA-transduced stable cells derived from SW620 and LOVO. b, c The migratory and invasive properties of the stable cell lines were analyzed using Boyden chambers or Matrigel-coated Boyden chambers. Error bars represent the mean ± s.d. from three independent experiments. d, e Wound-healing assay. Histograms represent the average migrated distances at the indicated times. Error bars represent the mean ± s.d. from three independent experiments. f Three-dimensional morphology analysis. Histograms represent the average number of filopodia formed by each cell sphere from three independent experiments. Error bars represent the mean ± s.d. g Representative gross and microscopic images of the intestines and livers are shown. The sections were stained with H&E. The arrows indicate the primary tumors in the intestines, visible metastatic nodules in the liver and infiltrative tumors in the intestine. h The number of visible metastatic nodules in the liver. i Overall survival times of the different group of mice bearing liver metastases. **p < 0.01

