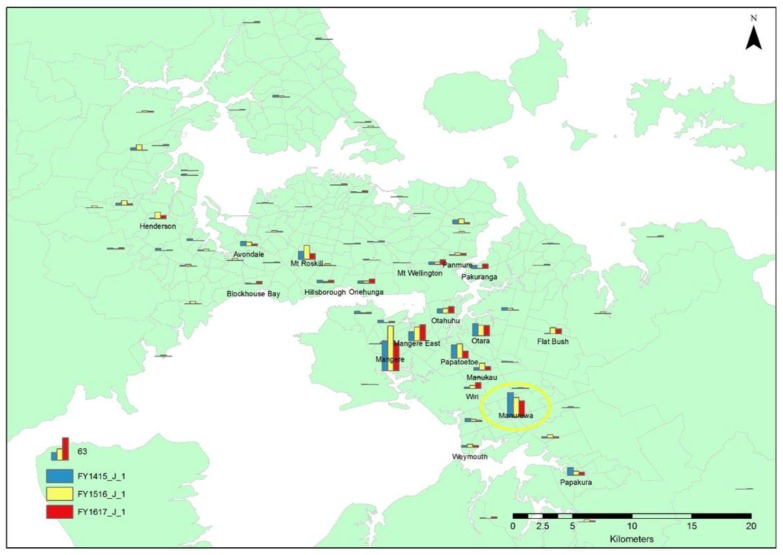
Figure 2.
Map of Auckland showing the distribution of the origin of neonatal/underage euthanasias for the 2014/2015, 2015/2016, and 2016/2017 financial year periods. (FY1415_J_2 and FY1415_A_1 = neonatal/underage euthanasias during the 2014/2015 financial year period, FY1516_J_2 and FY1516_A_1 = neonatal/underage euthanasias during the 2015/2016 financial year period, and FY1617_J_2 and FY1617_A_1 = neonatal/underage euthanasias during the 2016/2017 financial year period). The yellow circle highlights the data for Manurewa, the suburb targeted by the TTNR pilot programme.

