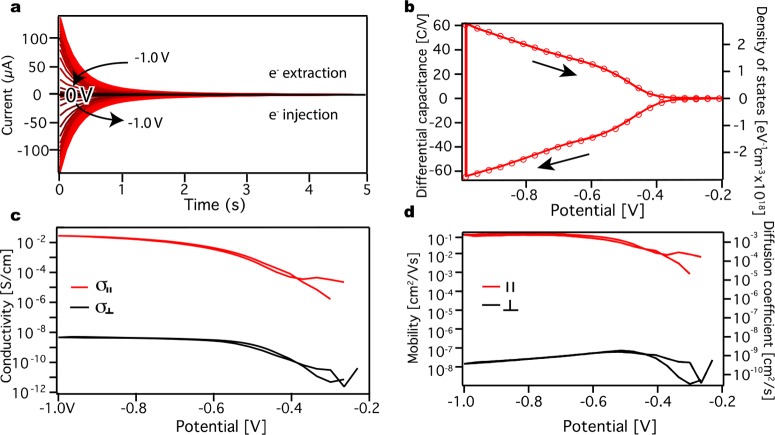
Figure 3.
Differential capacitance and electronic source-drain conductance measurements. (a) Differential capacitance measurements performed on a ZnO QD film on an IDE in 0.1 M LiClO4 acetonitrile electrolyte solution. Potential steps of 35 mV were taken, and the current was measured for 5 s until equilibrium was reached. The potential was stepped from 0 to −1.0 V and then reversed to 0 V. (b) The differential capacitance of the QD film with units of C/V is on the left axis, while the density of states is shown on the right axis. Arrows indicate the scan direction. (c) Calculated parallel source-drain electron conductivity (red line) compared to the perpendicular electron conductivity (black line). (d) Difference in parallel source-drain electron mobility (red) and the perpendicular mobility (black) on the left axis and the parallel (red) and perpendicular (black) diffusion coefficients on the right axis.

