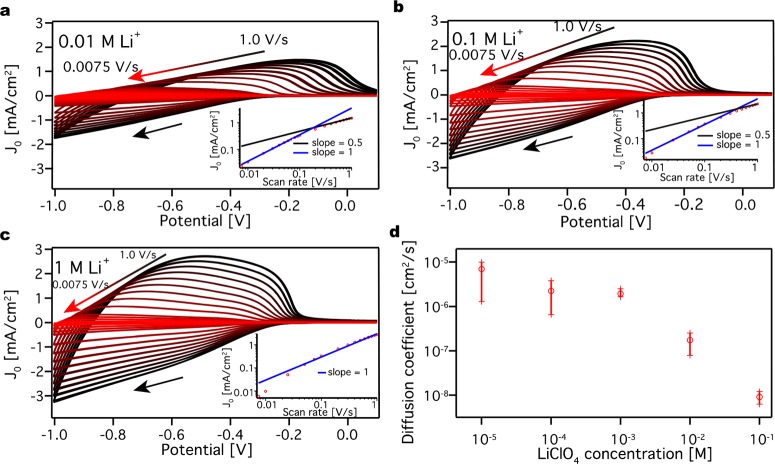
Figure 4.
Determination of diffusion coefficients
in LiClO4 acetonitrile
electrolyte solution. Cyclic voltammograms at different scan rates
for a ZnO QD film in (a) 0.01 M LiClO4 acetonitrile electrolyte
solution, (b) 0.1 M LiClO4 acetonitrile electrolyte solution,
and (c) 1 M LiClO4 acetonitrile electrolyte solution. J0 stands for the current density. The panels
include a peak current density versus scan rate plot on a log–log
scale. The slope is given by  , where v stands for the
scan rate. The scans have negative direction, indicated by a black
arrow. By increasing the electrolyte concentration, the current and
the symmetry increases. (d) Average diffusion coefficient and the
standard deviation obtained from three different measurements for
different concentration of LiClO4 acetonitrile electrolyte
solution.

