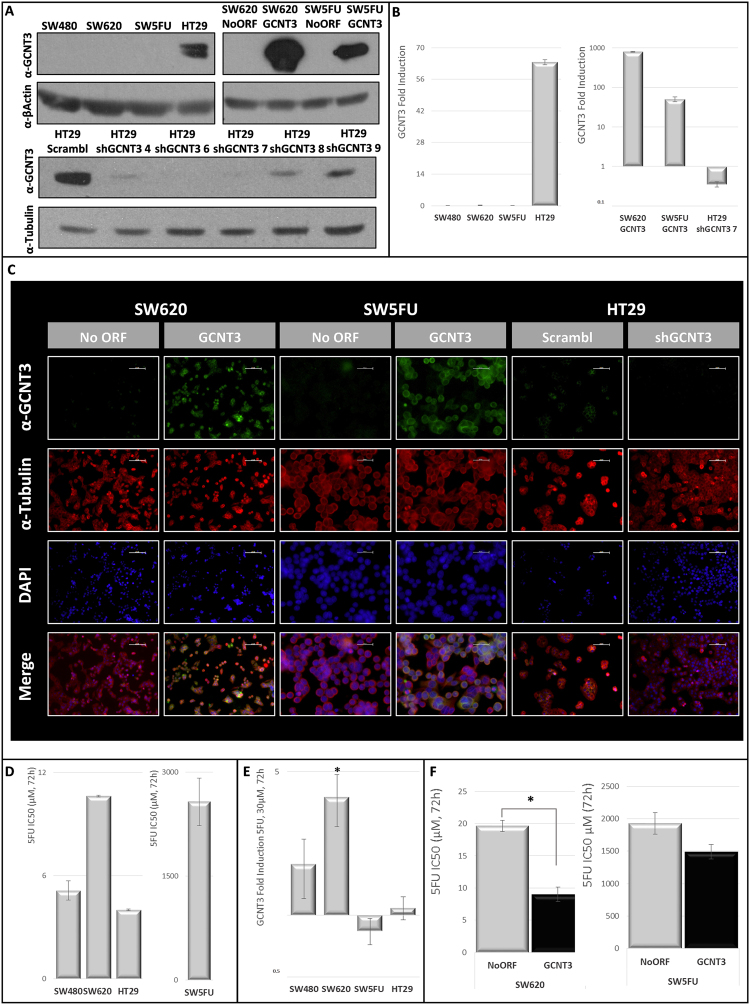
Figure 1.
GCNT3 overexpression reduces 5FU resistance in CRC cells. (Panel A) Protein expression levels of GCNT3 in non-infected colorectal cancer (CRC) cells, stable cell lines overexpressing GCNT3 and a battery of shGCNT3. Proteins were detected by western blot using specific antibodies against GCNT3, β-Actin and β-Tubulin, as a loading control. Full-length blots/gels are presented in Supplementary Fig. 2. (Panel B) mRNA expression levels of GCNT3 measured by RT-QPCR, in non-infected CRC cells, stable cell lines overexpressing GCNT3 and shGCNT3 number 7. Data represent mean ± SEM of three independent experiments. (Panel C) Representative immunofluorescence images of GCNT3 (green) and Tubulin (red) of NoORF, GCNT3, Scrambl and shGCNT3 7 cells. Nuclei were stained with DAPI (blue). Scale bars 50 µm. (Panel D) Comparison of 5-fluoracil (5FU) IC50 values (concentration needed for 50% of viability inhibition) between non-infected CRC cells. Cell viability assays were performed after 72 h treatment. Data represent mean ± SEM of at least two independent experiments each performed in triplicate. (Panel E) Induction of GCNT3 expression by 5FU in CRC cells. Tumour cells were treated with 30 µM 5FU, during 72 h, and their mRNA GCNT3 expression was measured by RT-QPCR and represented in comparison to controls (vehicle-treated cells). Results are expressed as the mean ± SEM. of three independent experiments, each performed in triplicate. Student’s t test was applied to assess statistically significant differences (*p < 0.05). (Panel F) Comparison of 5FU IC50 values between NoORF and GCNT3 cells. Cell viability assays were performed after 72 h treatment. Data represent mean ± SEM of at least three independent experiments each performed in triplicate. Asterisk indicates statistically different values in GCNT3 cells respect to the control (NoORF cells), (*p < 0.05).

