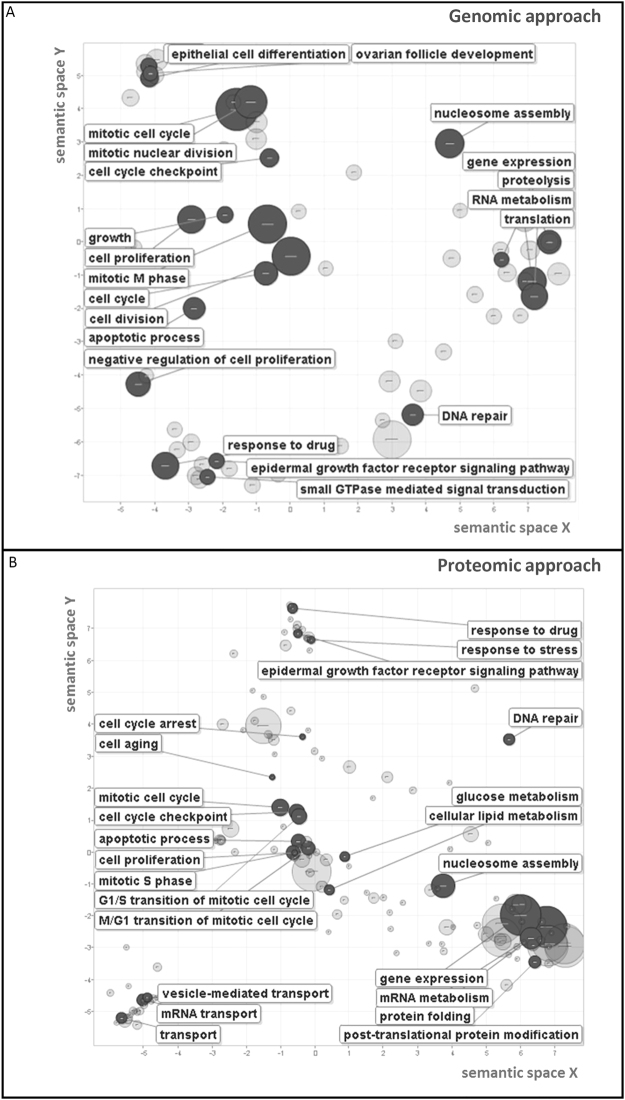
Figure 5.
Biological processes enriched by GCNT3 overexpression in CRC cells. REViGO Scatterplot of GO categories enriched in GCNT3 genomic (Panel A) and proteomic (Panel B) analysis. GO enrichment analysis for statistically significant transcripts and proteins. The remaining terms after the redundancy reduction were plotted in a two dimensional space. Bubble sizes indicates the p-value (log10 p-value). Semantic space is based on the semantic similarity, which is the degree of relatedness between two entities by measuring the similarity of their annotation meanings. The list of enriched GO terms is subjected to redundancy reduction, based on the “most informative common ancestor” approach in REVIGO and is represented by cluster representatives in a scatterplot. The x- and y-axes of the scatterplot represent the distance between the cluster representatives.

