Figure 6.
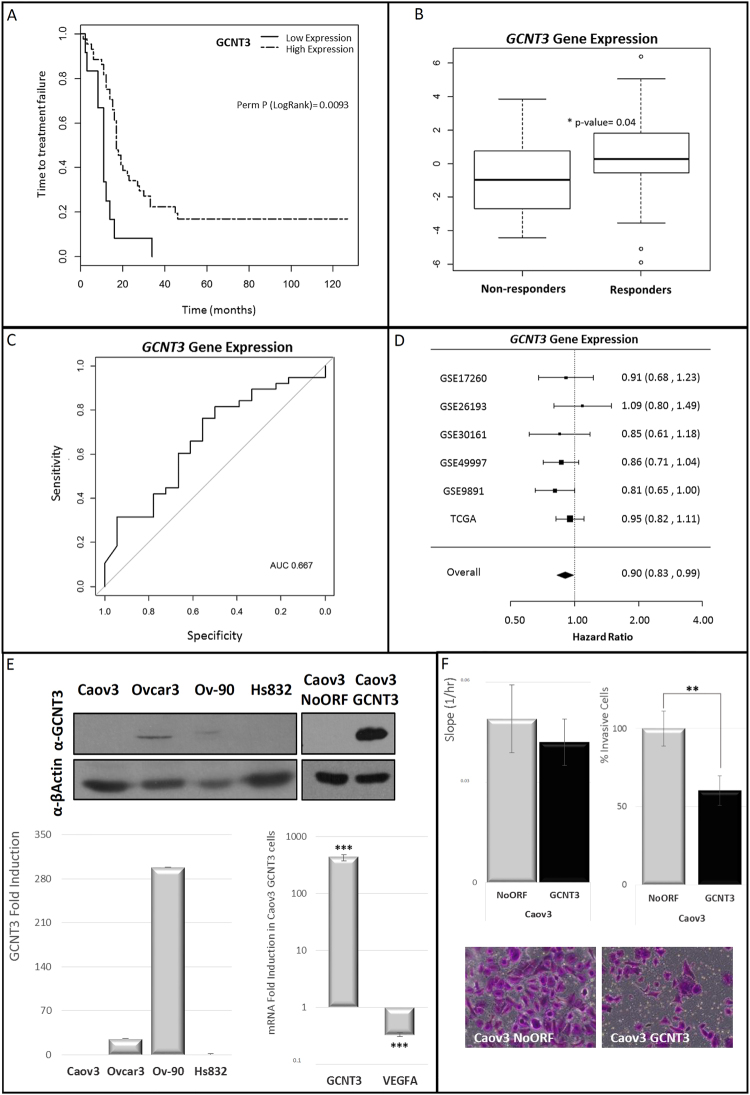
Clinical relevance of GCNT3 expression in epithelial ovarian cancer (EOC). (Panel A) Association between GCNT3 expression and time to treatment failure (TTF) in EOC. Kaplan–Meier plots for GCNT3 expression in 56 EOC patients. (Panel B) Association of GCNT3 gene expression profiles with response. The expression levels of GCNT3 in non-responders and responders groups are shown. The median value of GCNT3 expression is indicated by the horizontal bar on the graph (Man-Whitney U-test for P values). (Panel C) ROC analysis of the GCNT3 signature in EOC patients. The AUC was 0.667. (Panel D) Forest plot showing the meta-analysis of hazard ratio (HR) and 95% confidence interval (CI) estimates for TTF for the prognostic significance of GCNT3 expression in EOC patients from six different studies. (Panel E) Protein and mRNA expression levels of GCNT3 in non-infected EOC cells and Caov3 stable cell lines overexpressing GCNT3. Proteins were detected by western blot using specific antibodies against GCNT3 and β-Actin. mRNA expression levels of GCNT3 and VEGFA were measured by RT-QPCR. Data represent mean ± SEM of three independent experiments. Student’s t test was applied to assess statistically significant differences (***p < 0.001). Full-length blots/gels are presented in Supplementary Fig. 4. (Panel F) Boyden chamber transwell assay of GCNT3 Caov3 invasion through Matrigel. After 96 h, Caov3 cells were fixed and stained with crystal violet (bottom panels) and counted under an optical microscope. Pictures were taken using an Olympus CKX41 microscope (Olympus, Tokyo, Japan), with a 20X LCAch objective and registered using analysis getIT software (Olympus). Scale bars 100 µm. On the left, xCELLigence proliferation assay of NoORF and GCNT3 Caov3 cells. The rate of proliferation is determined by analyzing the slope of the proliferation line between the 12 and 60 h interval. Data are represented as mean ± SEM of three independent experiments each performed in triplicate. Student’s t test was applied to assess statistically significant differences (**p < 0.01).

