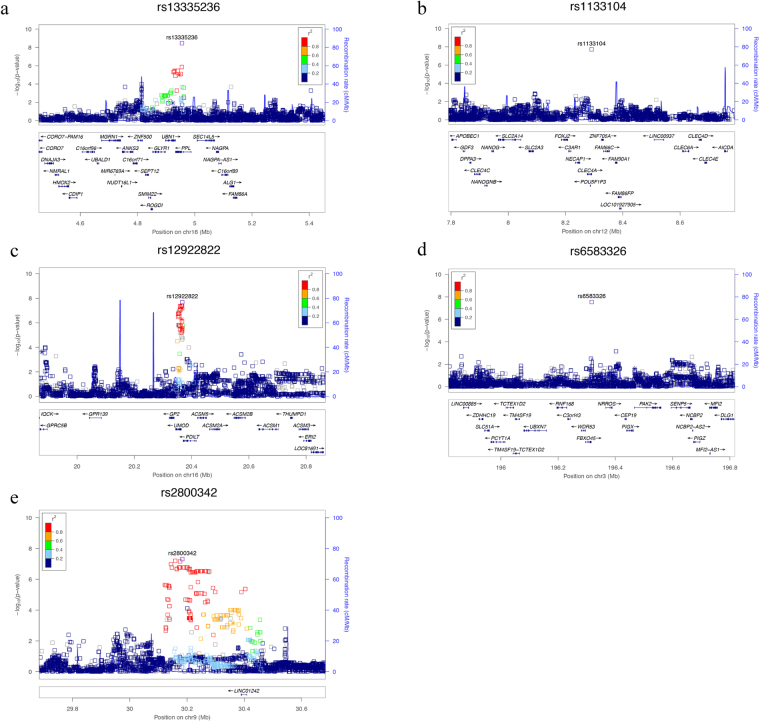
Figure 1.
(a–e) LocusZoom plots of genome-wide significant (p < 5*10E-08) associations. LocusZoom plots show the association (left y-axis; log10-transformed p-values). Genotype SNPs are represented by stars, imputed SNPs are represented by squares. Shading of the points represent the linkage disequilibrium (r2, based on the 1000 Genomes Project) between each SNP and the top SNP. The blue overlay shows the recombination rate (right y-axis). Positions of genes are shown below the plot.

