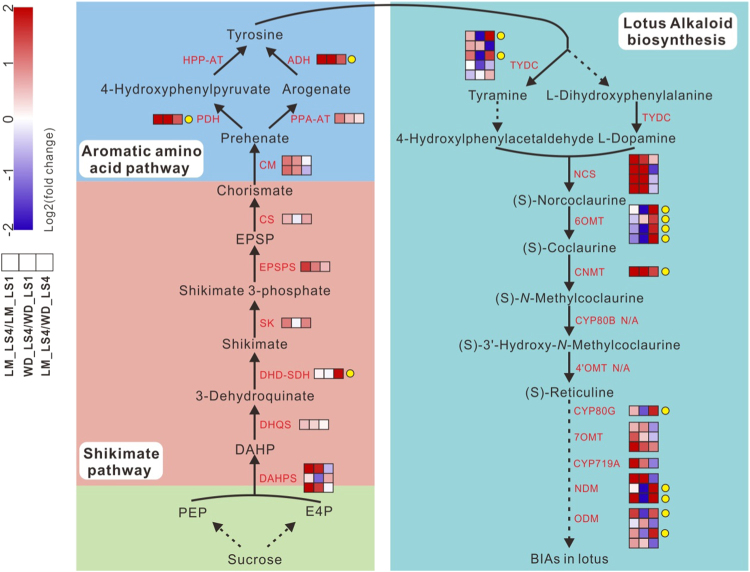
Fig. 4. Schematic diagram of fold change in expression level of structural genes in BIA, shikimate, and aromatic amino acid pathways in lotus leaf between two stages of the same cultivar or between cultivars with the same stage 4.
Three boxes that are arranged in the same row indicate comparisons of LM_LS4/LM_LS1, WD_LS4/WD_LS1, and LM_LS4/WD_LS4, respectively. The layers of boxes represent different gene copies, which are listed in a numerical order from top to bottom. LM_LS4/LM_LS1 and WD_LS4/WD_LS1 represent comparison of gene expression levels in leaves of cvs. LM and WD, respectively, between stages 1 and 4, while LM_LS4/ WD_LS4 indicates comparison of gene expression levels at stage 4 between cvs. LM and WD. The arrows with broken lines indicate multi-enzymatic reactions. PEP phosphoenolpyruvate, E4P d-erythrose 4-phosphate, DAHPS 3-deoxy-d-arabino-heptulosonate 7-phosphate synthase, DHQS 3-dehydroquinate synthase, DHD 3-dehydroquinate dehydratase, SDH shikimate dehydrogenase, SK shikimate kinase, PESPS 5-enolpyruvylshikimate-3-phosphate synthase, CS chorismate synthase, CM chorismate mutase, PPA-AT prephenate aminotransferase, ADH arogenate dehygrogenase, PDH prephenate dehydrogenase, HPP-AT 4-hydroxyphenylpyruvate aminotransferase

