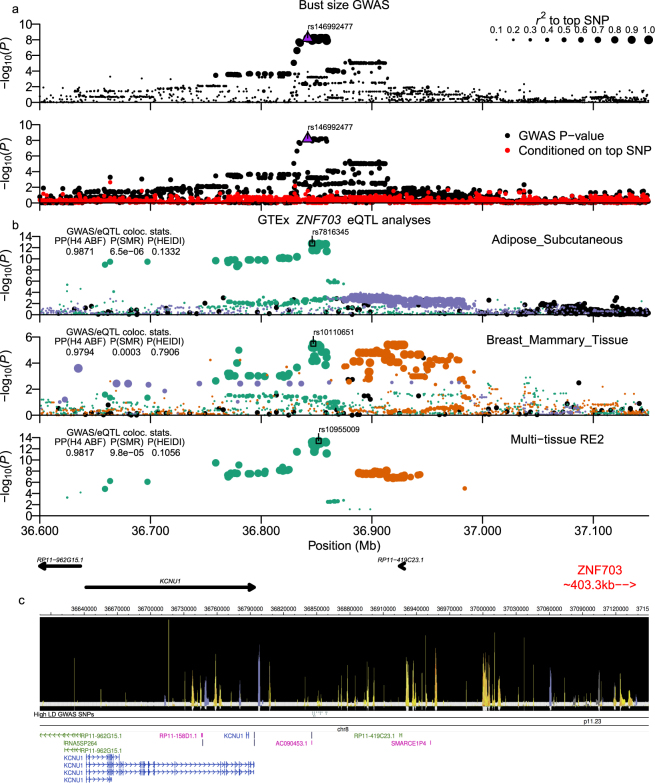
Figure 2.
Bust-size chr8:36.76–36.91 Mb (KCNU1/ZNF703) locus. Plot is configured the same as Fig. 1. (b) Analyses of GTExPortal eQTL data for ZNF703. Signals for ncRNA RP11-419C23.13 had strong support, but are shown in Supplementary Fig. S5. ABF colocalization analysis of multi-tissue data for both genes was run using Metasoft FE β-coefficients and standard errors as input. The gene model sub-panel highlights the two target eQTL genes in red and blue. All high LD GWAS variants shown in (c) also had RSS > 0.8 to top eQTL signal SNPs for each gene-tissue pair that is presented.

