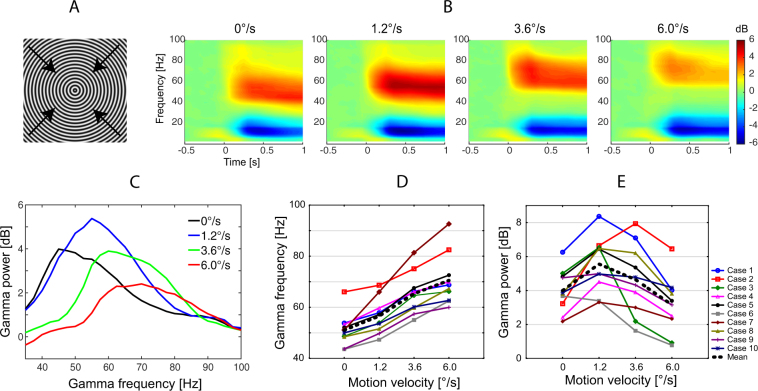
Figure 1.
Changes in gamma power and frequency induced by the visual presentation of the annular gratings. The grating displayed in panel A either remained static (0°/s) or drifted at one of the three velocities (1.2°/s, 3.6°/s or 6.0°/s) in the direction indicated by the arrows. (B) Grand average time-frequency plots. (C) Grand average spectra of sustained gamma response. Gamma power was computed in the 200–1200 ms time interval after stimulus onset and was normalized to the pre-stimulus baseline (−900 to 0 ms). (D,E) Individual peak frequency (D) and power (E) of sustained gamma responses. Here and hereafter, the frequency range of interest was established where the post-/pre-stimulus power ratio exceeded 2/3 of the peak value. The center of gravity of the power over this frequency range was used as the gamma peak frequency. The average power over these frequencies was used as the gamma peak power (see Material and Methods for details).

