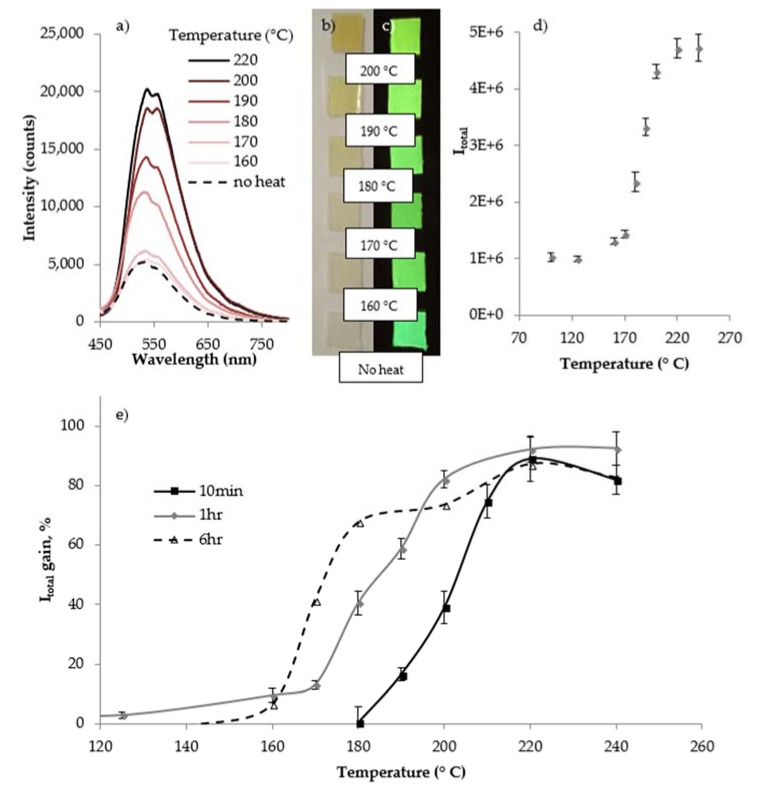
Figure 7.
Fluorescent response of sensors to 1 h thermal exposures at various temperatures. (a) Emission spectra; (b) Ambient light images showing color change; (c) Fluorescent images showing intensity increase; (d) Integrated intensity values for 1 h exposure; (e) Itotal gain % for 10 min, 1 h and 6 h exposures.

