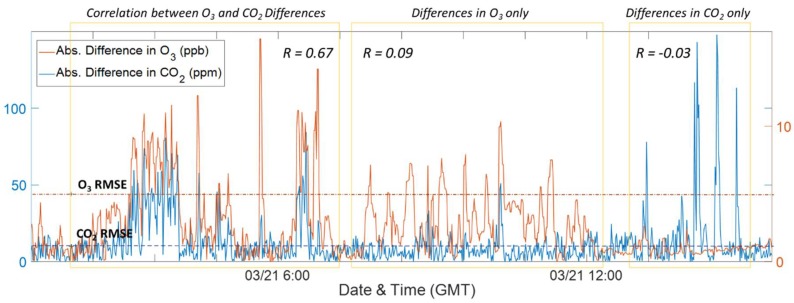
Figure 7.
Time series of absolute differences between Y-Pod B1 and Y-Pod B5 for CO2 (blue) and O3 (red), the RMSE for both the CO2 and O3 sensors are indicated using dotted lines. The yellow boxes highlight periods where the differences in the two signals are well-correlated verses periods where the differences are occurring primarily in the CO2 or O3 signal. The correlation coefficient (R) has been added to contrast the different periods.

