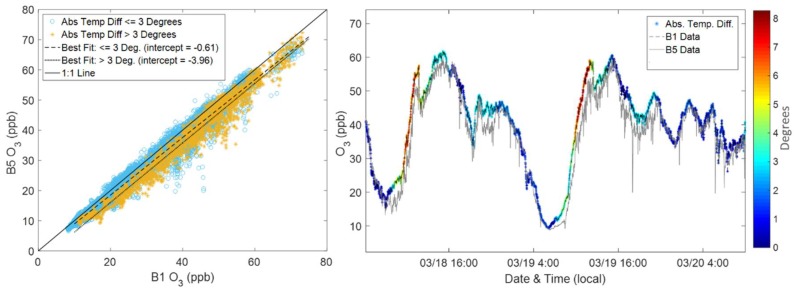
Figure 8.
Two plots illustrating the effect of temperature differences between the pods. The scatter plot (left) depicts B1 vs. B5, separating points where the temperature difference between the two pods is less than and greater than three degrees Celsius. The time series (right), shows two days of data from B1 and B5 where the B1 data also has an overlay of temperature differences between the pods.

