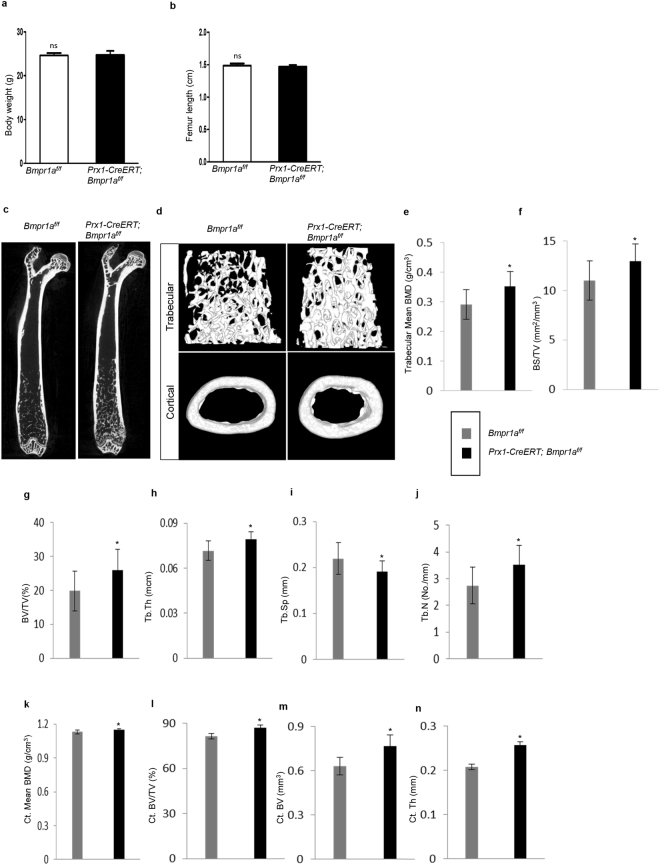
Figure 2.
Micro-CT-derived bone morphometry results revealed an increase in bone volume and bone mineral density in Prx1-CreERT; Bmpr1af/f mice. (a,b) Body weight and femur lengths of mutant and control littermates showed no significant difference. Data are expressed as mean ± SEM from 8 mice per group. (c) Representative micro-CT images of 2D whole femur segital section from adult Prx1-CreERT; Bmpr1af/f and their respective control mice. (d) 3D distal femoral metaphyseal cancellous bone (upper panel) and mid-diaphyseal cortical bone (lower panel). N = 8 mice per group. (e–j) Micro-CT quantification of bone histomorphometry indices revealed high trabecular bone mass in mutant mice. Tb. BMD, trabecular bone mineral density (g/cm3) (e); BS/TV, bone surface/tissue volume (mm2/mm3) (f); BV/TV, bone volume/tissue volume (%) (g); Tb.Th, trabecular thickness (mcm) (h); Tb.Sp, trabecular spacing (mm) (i); and Tb.N, trabecular number (No./mm) (j). (k–n) Micro-CT quantification revealed high cortical bone phenotypes in mutant mice. Ct. BMD, Cortical bone mineral density (g/cm3) (k); Ct, BV/TV, cortical bone mass (%) (l); Ct. BV, cortical bone volume (mm3) (m); and Ct.Th, cortical thickness (mm) (n). N = 8 mice per genotype; *P < 0.05.

