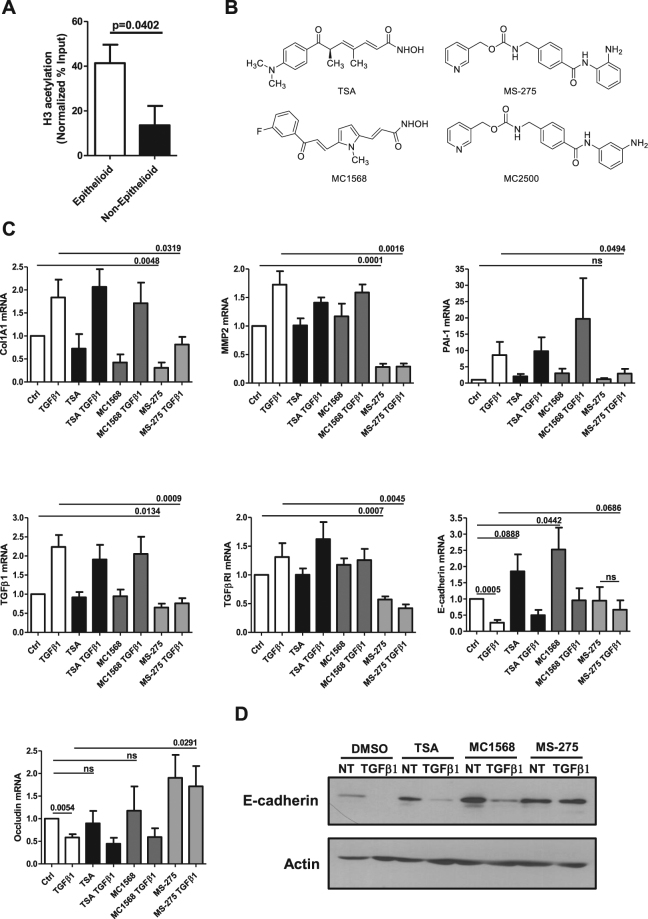
Figure 1.
Effect of Class I and Class II HDAC inhibition on epithelial and mesenchymal markers expression in MCs derived from peritoneal effluent of PD patients. (A) qPCR analysis of ChIP assays with anti-acH3 antibody and, as controls, normal rabbit IgG on chromatin from epithelial-like (epithelioid) MCs (left) and mesenchymal-like (non-epithelioid) MCs (right). Data show the enrichment of H3 acetylation on human E-cadherin promoter. Values derived from three independent experiments are normalized respect to the IP efficiency (evaluated through GAPDH promoter amplification). Data are reported as means ± SEM and expressed as ((IP-IgG) %Input). (B) Chemical structures of HDAC inhibitors used in this study. (C) MCs were treated with DMSO vehicle (Ctrl) or with TSA (TSA) (30 nM), MC1568 (10 μM), MS-275 (250 nM) for 72 h; samples were also either left untreated or were treated with TGFβ1 (2 ng/ml) for the last 24 h. Expression of Col1A1, MMP2, PAI-1, TGFβ1, TGFβRI, E-cadherin and Occludin was evaluated on total RNA by qRT-PCR. Bars represent means ± SEM of 5 experiments (for Col1A1 and Occludin n = 4). p-values are reported in the graphs. (D) Representative Western blot experiment of 5 performed showing expression of E-cadherin from cell lysates of MCs treated as above. Actin was used as a loading control. P < 0.05 was considered significant.

