Figure 1.
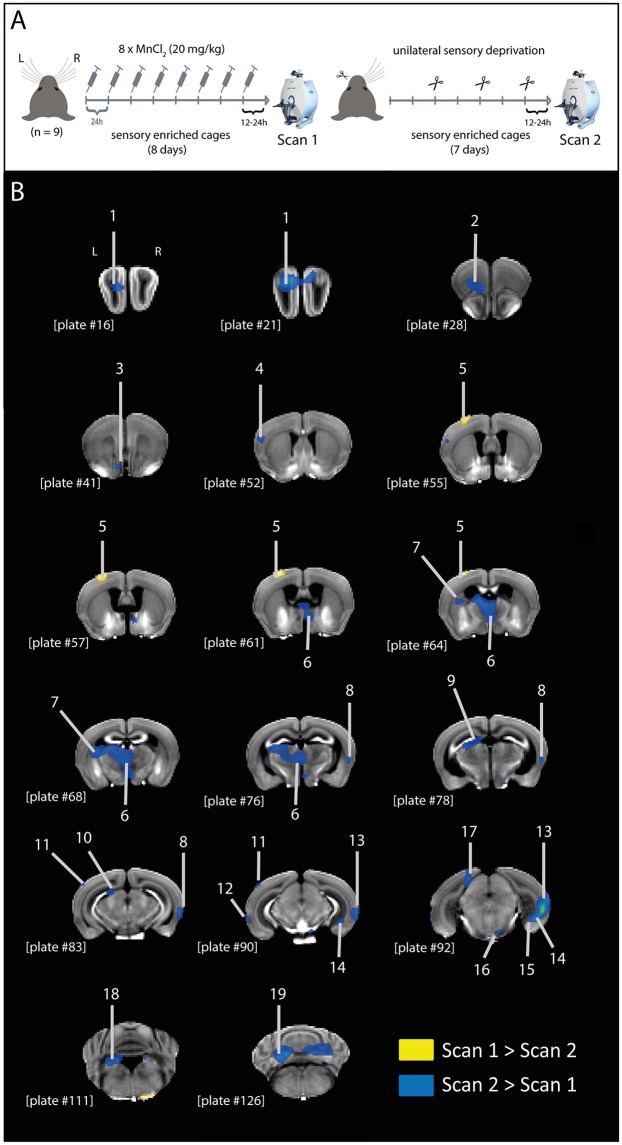
MEMRI contrast differences after unilateral sensory deprivation. (A) Graphic representation of experimental design. Mice were treated with MnCl2 (20 mg/kg; i.p.) for 8 days, while housed in a sensory enriched environment, until scan 1. Immediately after scan 1, mice had their left whiskers trimmed (procedure repeated every 2 days) and remained in the sensory enriched environment for 7 more days without further MnCl2 injections, until scan 2. (B) Representative coronal brain slices indicating the structures showing differential MEMRI signal in scans 1 and 2 (yellow: scan 1 > scan 2; blue: scan 2 > scan 1). Brain structures indicated in the figure: 1, olfactory bulb; 2, orbital area; 3, islands of Calleja; 4, supplemental somatosensory area; 5, barrel cortex; 6, medial thalamic nuclei; 7, caudoputamen; 8, temporal association area; 9, anterior pretectal nucleus; 10, nucleus of the optic tract; 11, anterolateral visual area; 12, perirhinal area; 13, temporal association area + ectorhinal area + perirhinal area; 14, subiculum—ventral part; 15, dentate gyrus—ventral part; 16, pontine nuclei; 17, retrosplenial area; 18, superior vestibular nucleus; 19, cerebellum. Plate numbers under brain slices correspond to the reference plate of the Allen Mouse Brain Atlas used to define the structures.

