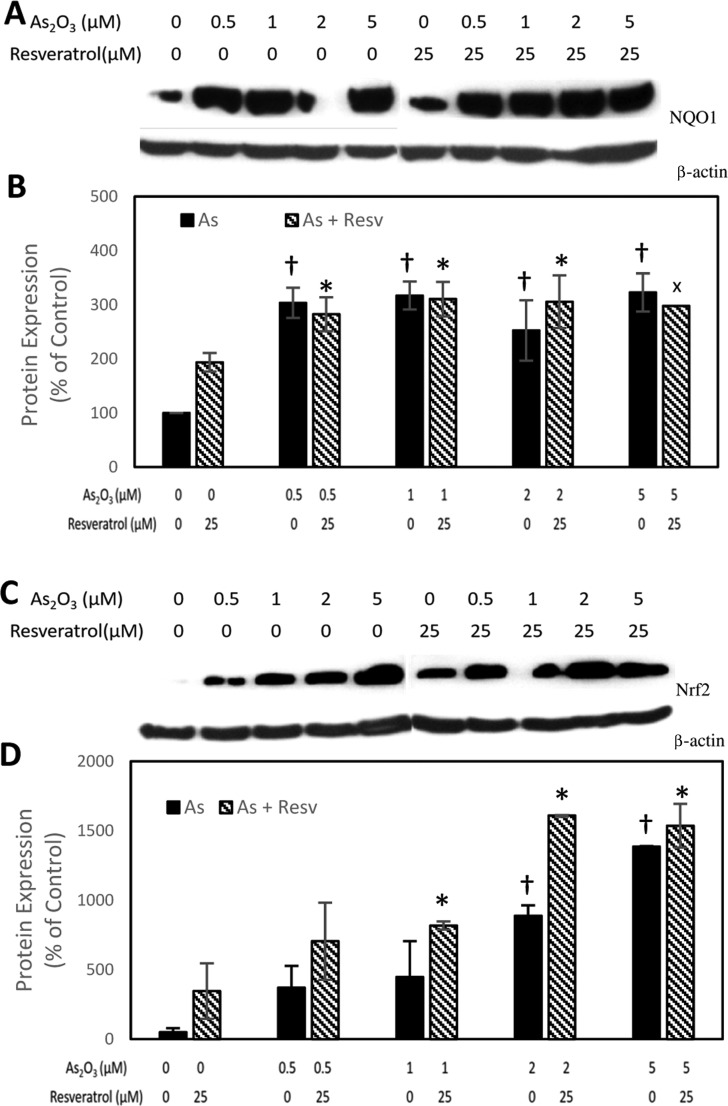
Figure 2.
Induction of NQO1 (A, B) and Nrf2 (C, D) by As2O3 with and without resveratrol. (A, C) Representative images. (B, D) Quantitative data. Data are presented as mean ± standard error of the mean protein expression (%) from three independent experiments (n = 3), X = mean of two experiments. A † indicates significant difference (p < 0.05) between As2O3 treatment groups and control, whereas an * indicates significant difference (p < 0.05) between As2O3 treatment groups and control in the resveratrol group.

