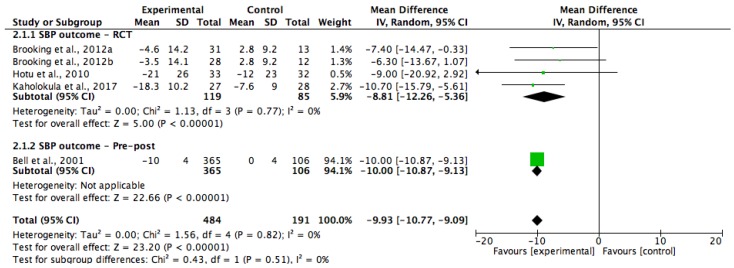
Figure 4.
Forest plot showing mean systolic blood pressure (SBP) change and the overall pooled estimate after a lifestyle intervention. One study had two interventions groups (32). Brooking et al., 2012a [35] = intervention group that emphasised on a fiber rich carbohydrate and fat reduction (HCHF) diet; Brooking et al., 2012b [35] = the intervention group that utilised a high protein (HP) diet.

