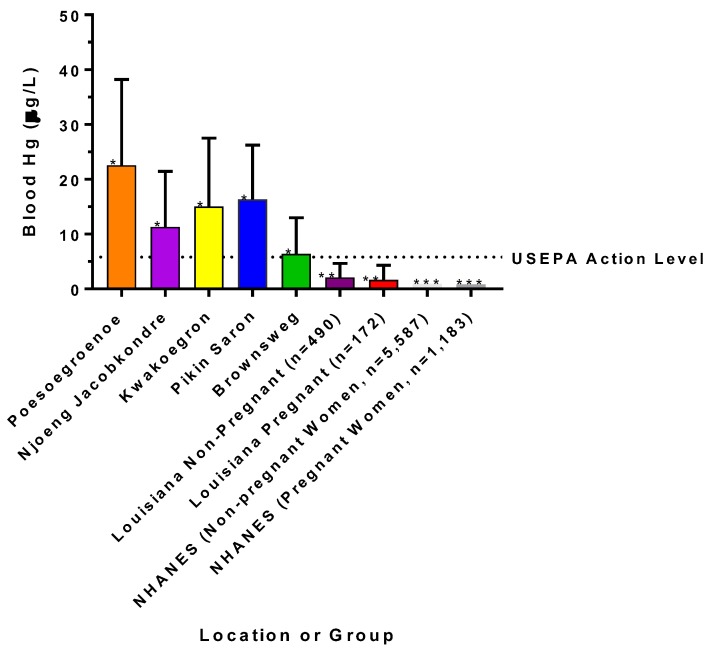
Figure 3.
Estimated geometric mean concentrations (± geometric standard deviation) of mercury in blood of women and children (combined) from interior villages in Suriname. Geometric mean concentrations (± geometric standard deviation) of mercury in blood of women (pregnant or non-pregnant) from coastal southeast Louisiana, as well as those representing national averages from the NHANES are also presented for comparative purposes. The USEPA action level of 5.8 µg/L is plotted for comparison. Asterisks denote significant differences at p < 0.05.

