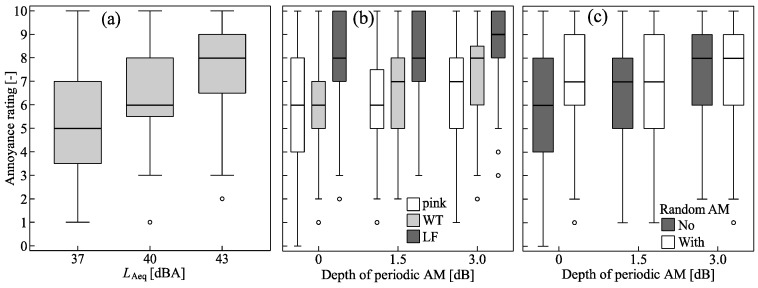
Figure 5.
Boxplots of the short-term annoyance ratings as a function of (a) the LAeq (Subset I), (b) depth of periodic amplitude modulation (AM) and spectral shape (pink, wind turbine (WT), low frequency (LF); pooled data of situations with/without random AM), and (c) periodic AM and random AM (pooled data of situations with different spectral shapes) (Subset II). Boxes represent the interquartile range (25% and 75%) and the median (50%, horizontal line in boxes), whiskers the data within 1.5 times the interquartile range, and circles outliers outside the whiskers.

