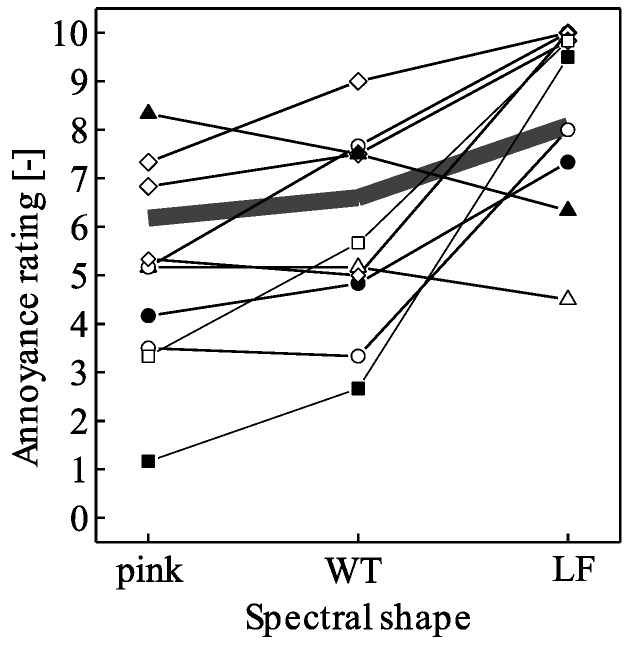
Figure 6.
Examples of individual annoyance ratings (mean values per participant and spectral shape, pooled data of situations with/without random and/or periodic amplitude modulation) of 10 randomly selected participants as a function of spectral shape (pink, wind turbine (WT), low frequency (LF)). Different symbols connected by lines represent different participants, and the grey bold line shows the average of all 52 participants.

