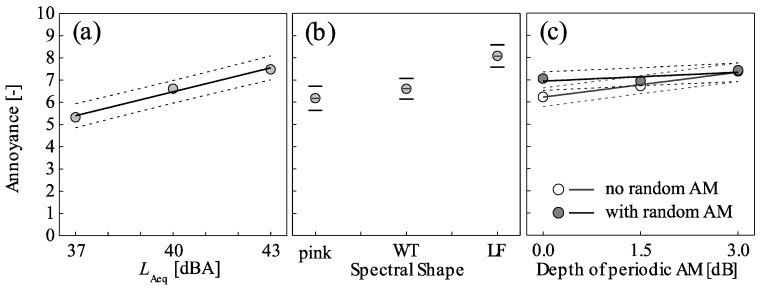
Figure 7.
Mean short-term annoyance as a function of (a) the LAeq (Subset I), (b) spectral shape (pink, wind turbine (WT), low frequency (LF); pooled data of different situations of periodic and random amplitude modulation (AM)), (c) and periodic and random AM (pooled data of situations with different spectral shapes) (Subset II). Symbols represent observed values, and lines the corresponding mixed-effects model with 95% confidence intervals, in (b) as horizontal lines.

