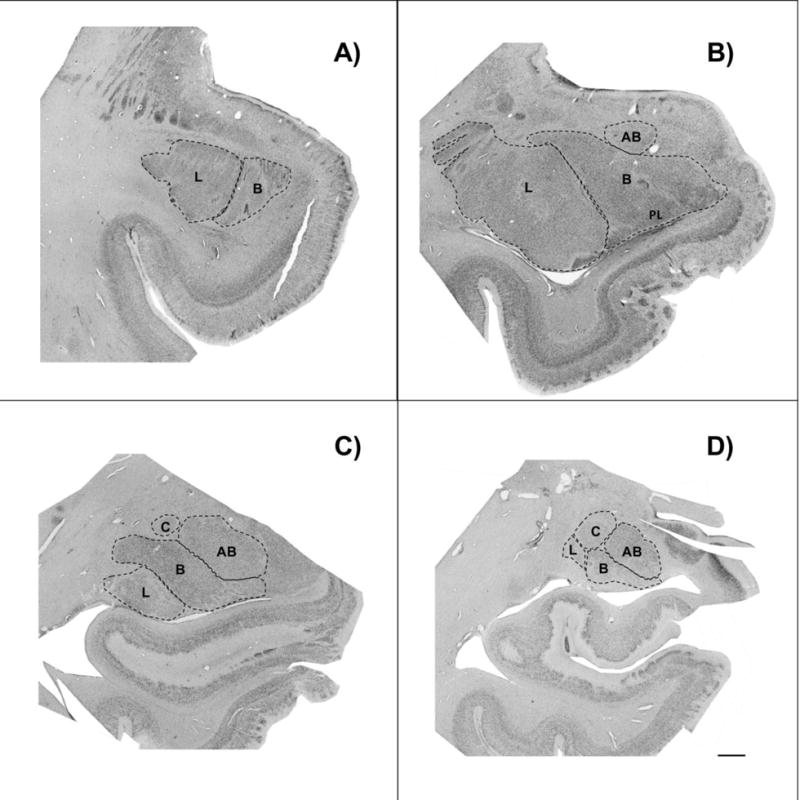
Figure 1.

Brightfield photomicrograph of Nissl-stained coronal sections through rostral A), midrostro-caudal B) and C), and caudal D) levels of the amygdala from a typically developing subject, demonstrating nuclei boundaries used in data collection. L= lateral nucleus of the amygdala; B= basal nucleus of the amygdala; AB= accessory basal nucleus of the amygdala; C= central nucleus of the amygdala. Scale bar= 2 mm.
