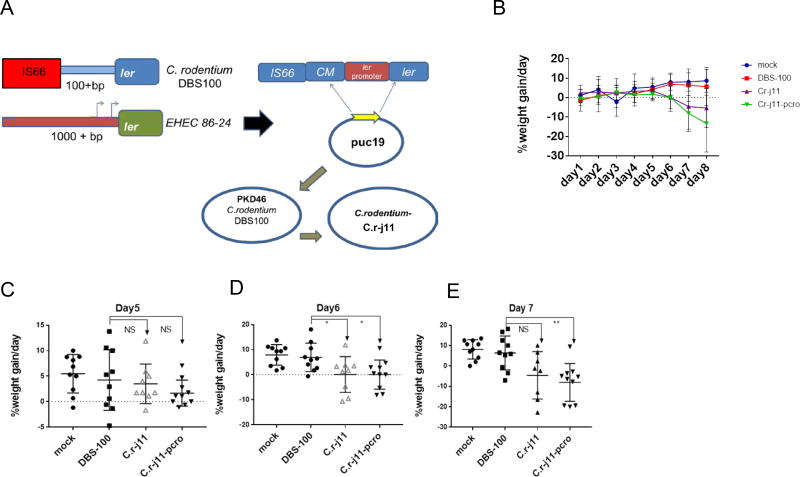
Figure 5. Cro augments mouse disease progression upon C. rodentium infection.
(A) Cartoon depicting the strategy utilized to exchange the EHEC ler promoter region to C. rodentium ler promoter region. The promoter was successfully exchanged using the λ recombination method, obtaining C.r-j11 and C.r-j11-pcro strains.
(B) Weight loss or gain from baseline (weight at day 0) over the course of infection (Blue: mock infected, Red: C. rodentium DBS100 wt, Purple: C. rodentium C.r-j11 pWSK129, and Green: C. rodentium C.r-j11-pcro) (n=10, error bars, standard deviation).
(C) Day 5 weight loss or gain statistical analysis comparing DBS100 against C.r-j11 pWSK129 and C.r-j11-pcro showing no statistical difference (NS).
(D) Day 6 weight loss or gain statistical analysis, comparing DBS100 against C.r-j11 pWSK129, and C.r-j11-pcro were depicting statistical difference at P<0.05.
(E) Day 7 weight loss or gain statistical analysis comparing DBS100 against C.r-j11pWSK129 and C.r-j11-pcro. The analysis shows statistical difference between DBS100 and C.r-j11-pcro (P<0.01), and no significance were observed comparing DBS100 and C.r-j11 pWSK129.
The nonparametric Mann-Whitney U test was used to determine the statistical significance using Graphpad prism software. See also Figure S6.

