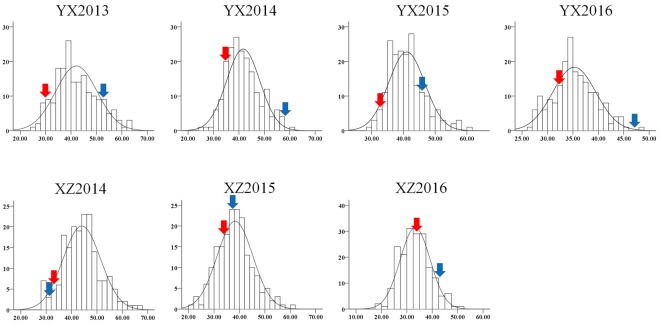
Figure 1.
Phenotype distribution of plant height in two RIL populations. The y-axis represents frequency; the x-axis represents value of plant height. YX “Yuanza9102 × Xuzhou 68-4” RIL population, XZ “Xuhua 13 × Zhonghua 6” RIL population. Red and blue arrows denote female and male parents, respectively.

