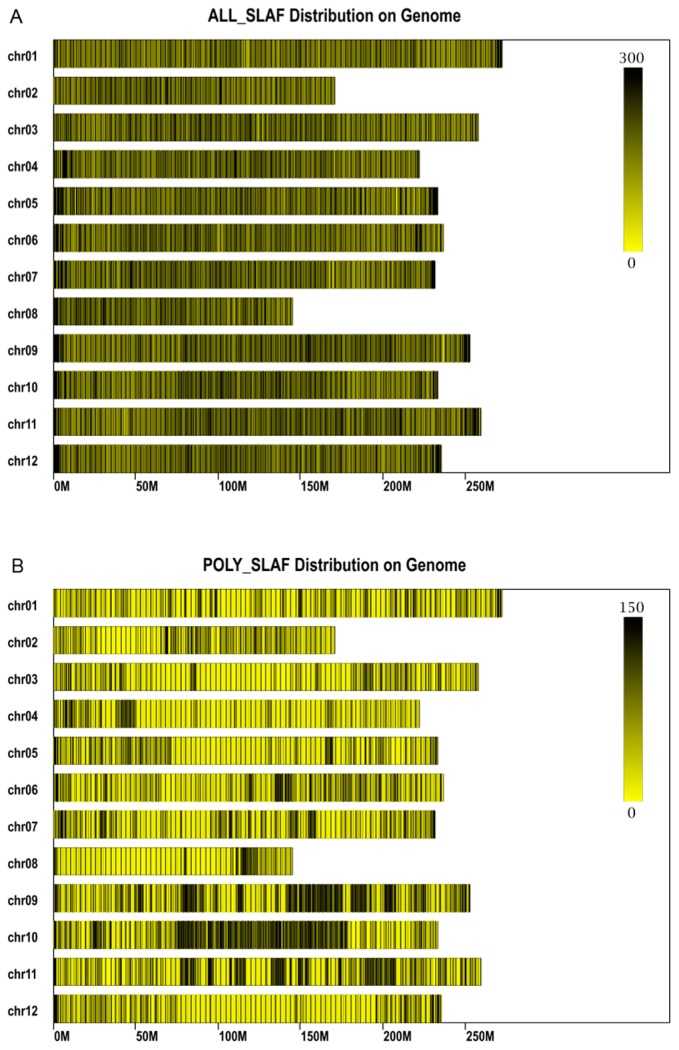
Fig. 2.
The SLAFs distribution on genome of pepper. The x-axis represents chromosome length and the y-axis indicates chromosome code. The yellow bars represent chromosomes, and deeper color from yellow to black represents higher SLAFs at the corresponding location. (A) The distribution of all 885,499 of high quality SLAFs (ALL_SLAF) on genome of pepper. (B) The distribution of 210,077 of polymorphic SLAFs (POLY_SLAF) on genome of pepper.

