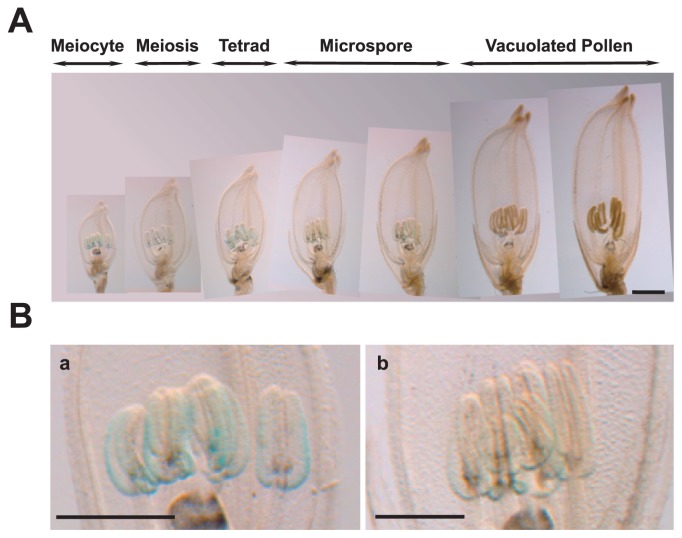
Fig. 2.
Histochemical GUS analysis of T0 rice transformed pBoA9:: GUS. (A) Spatial and temporal expression pattern of the BoA9::GUS fusion product in spikelets at various developmental stage of pollen. Scale bars = 1 mm. (B) Magnification of the anther views in each stage. (a) Meiocyte, (b) Microspore. Scale bars = 0.5 mm.

