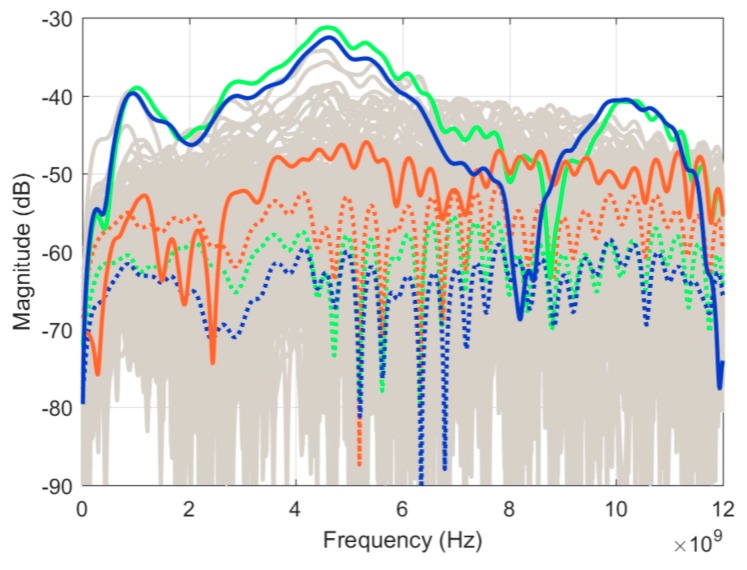
Figure 9.
Differences between scans for each signal in the frequency domain. All signals are in grey with average values in dotted green, red, and blue for Scan2-Scan1, Scan 3-Scan1 and Scan3-Scan2 respectively. Residual response at position 127 in solid green, red, and blue for Scan2-Scan1, Scan 3-Scan1 and Scan3-Scan2, respectively.

