. 2018 May 11;9(21):4851–4858. doi: 10.1039/c7sc04309k

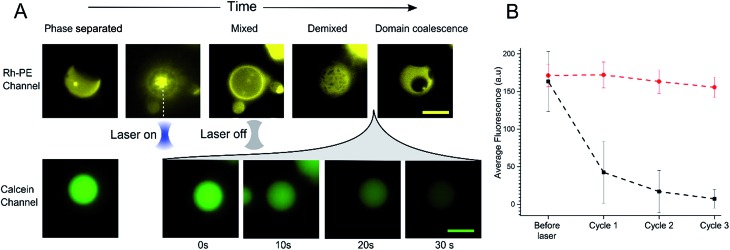
Fig. 3. (A) Image sequence showing the heating process for a DOPC : DPPC : Chol 1 : 1 : 3 phase separated GUV using an optical trap. Once the laser was turned on the sample was locally heated and the ordered and disordered liquid domains mix into a uniform state (above the Tm ∼ 32 °C). After this point the laser was switched off to allow the GUV to cool and the domains to demix and eventually coalesce. Imaging the same vesicles in the calcein channel revealed leakage once the GUV was heated above Tm and allow to cool (∼30 seconds). Scale bars = 10 μm. (B) Graph showing average mean fluorescence of phase separated GUVs (black squares) or single phase DOPC GUVs (red circles) (diameter 7–12 μm) after successive cycling events. Error bars = 1 S.D., n = 10.

Fig. 3