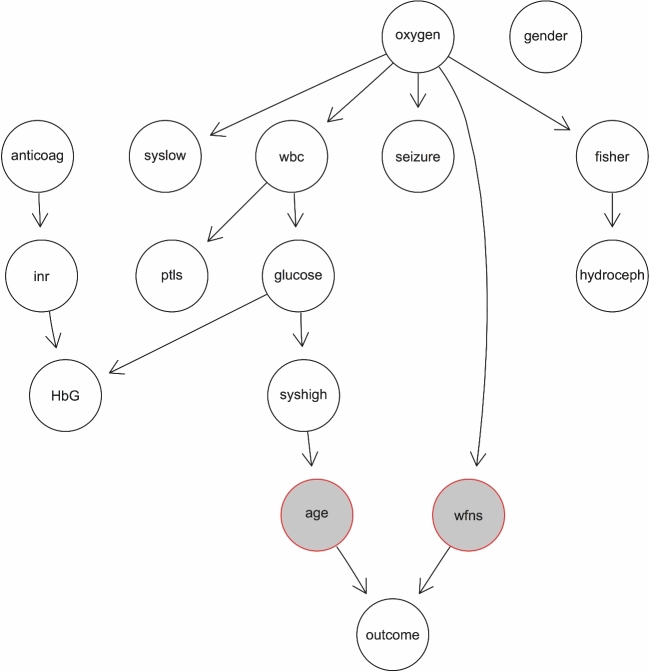
FIGURE 2.
DAG depicting Bayesian networks with probabilistic associations between key predictors (highlighted in gray) and remaining variables. Note the widespread influence of oxygen requirements and the associations of laboratory/cardiovascular parameters with age. See Table 1 for abbreviations.

