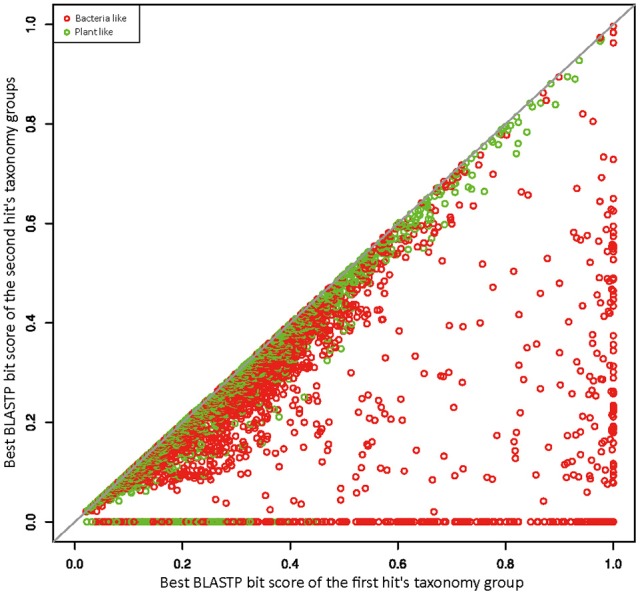
Figure 1.

Similarity plot of R. irregularis bacteria- and plant-like proteins. Circles represent relative bit scores of R. irregularis proteins. The x axis is the best bit score produced by BLASTP against bacteria/plants (first hit's taxonomy group). The y axis is the best bit score generated by BLASTP against second hit's taxonomy group (which contains all sequences not belonging to first hit's taxonomy group and fungi). To get the relative bit score, actual bit score is divided by bit score of the query sequence BLASTP against itself.
