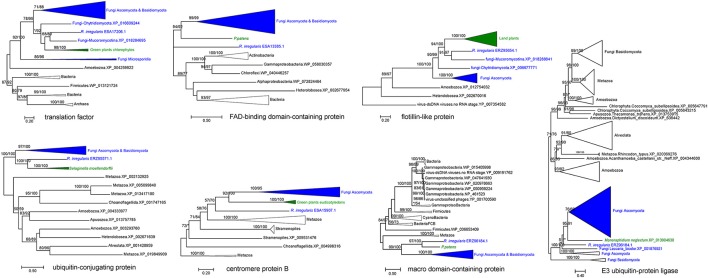
Figure 3.
Molecular phylogenies of genes horizontally transferred between plants and fungi (including R. irregularis). Fungal and plant sequences were shown in blue and green, respectively. Subtrees containing sequences from the same taxonomic clade were condensed. Numbers beside branches represent bootstrap values from maximum likelihood and Bayesian analyses, respectively. Asterisks indicate values lower than 50%. Scale bars represent the number of amino acid substitutions per site. Detailed molecular phylogenies for these genes were displayed in Supplementary Figures 14–20.

