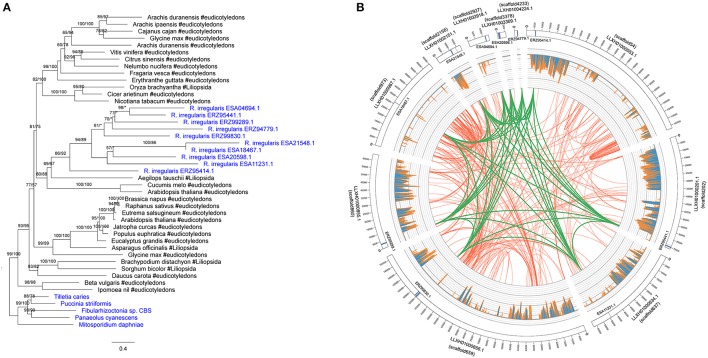
Figure 4.
(A) Molecular phylogeny of the MULE transposase family. Fungal sequences were obtained from BLASTP output (E-value cutoff: 1) and keyword search result. Numbers beside branches represent bootstrap values from maximum likelihood and Bayesian analyses, respectively. Asterisks indicate values lower than 50%. Scale bar represents substitution numbers per amino-acid site. Fungal sequences are colored in blue. (B) Circular visualization of the transposase genes mapped on the different scaffolds of R. irregularis. Scaffold accession numbers are indicated beside the scaffold bars. The scaffold IDs assigned by Chen et al. (2018) are indicated in parentheses. The sequences maintaining syntenic relationship are linked by lines. Green links: synteny blocks of the transposase genes; Red links: synteny blocks of other segments. The histograms in the middle represent the number of mapped RNA-seq reads.

