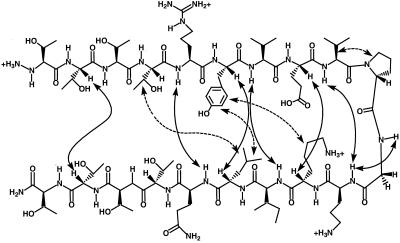
Figure 4.
NOEs between nonadjacent residues observed in NOE spectroscopy and ROESY analysis for 1 mM DP-TT2 in H2O/D2O (9:1 vol/vol) or in D2O, 4°C, 100 mM sodium deuterioacetate buffer, pH 3.8 (uncorrected), 200 ms mixing time. The solid arrows indicate NOEs between protons in the backbone and the dashed arrows indicate networks of NOEs between side chains. The backbone Hα-Hα NOE between Thr-4 and Thr-17 and NOEs between Thr side chains could not be observed because of resonance overlap.

