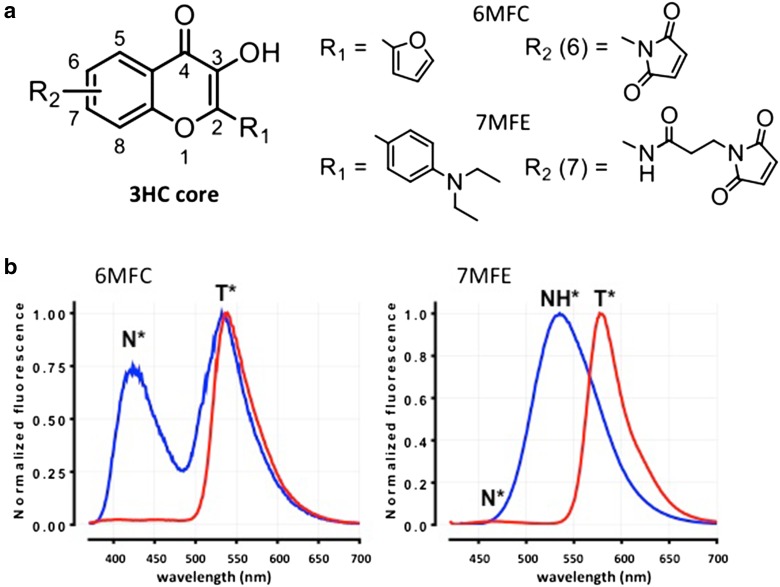
Fig. 2.
Chemical structure of the 3HC core (a) and spectra (b) of 6MFC and 7MFE. R1 and R2 indicate the corresponding substituents at position 2 and positions 6 and 7, respectively. Emission spectra in toluene (red) and methanol (blue) with excitation at 360 and 420 nm for 6MFC and 7MFE, respectively. The number, position, shape and relative intensities of bands depend on the polarity and H-bonding capacity of the probe microenvironment

